I am going to talk something that I got really excited about as a tool that you must have if you are into IT support.
The tool is a Microsoft built tool named XPERF.
Xperf is an advanced troubleshooting tool that digs deeper into performance issues than Perfmon ever dreamed of. It is part of a product suite called the Windows Performance Toolkit (WPT), which is part of the Microsoft Software Development Kit (SDK). Xperf leverages Event Tracing for Windows (ETW), a built-in component of the server operating system that provides detailed performance and system data.
The Xperf utility excels in troubleshooting areas like responsiveness issues, slow boot times, high CPU and disk usage, application delays and slow transitions. It’s supported across x86, x64 and IA-64 architectures with less than 2.5% CPU overhead while gathering over 20,000 events per second.
In other words, this is one tool you’ll definitely want to add to your toolbox. But before we get into the many features Xperf has to offer, let’s first go through a short tutorial of how to install and use the tool for troubleshooting Windows performance issues.
Installing Xperf
As previously mentioned, the Windows Performance Toolkit is distributed with the Windows Software Development Kit. To install the SDK, however, you must first install Microsoft .NET Framework 4. Unless you want to install the entire 4 GB SDK, you should only select the Windows Performance Toolkit and the Debugging Tools for Windows options, as shown in Figure 1.
You will also want to select Redistributable Packages for the WPT and Debugging Tools options so that individual kits are available for future installations without forcing you to reinstall the SDK. The resulting Windows Performance Toolkit and debugging kits can be found in:
C:\Program Files\Microsoft SDKs\Windows\v7.1\Redist\Windows Performance Toolkit
Figure 1: Installation options for Windows SDK (click to enlarge)

If you run into any problems during the SDK installation, you can refer to this troubleshooting page for assistance with things like clearing the AppData\Local\Temp folder (which I had to do). After the installation, a new program group will be created for the WPT, as shown in Figure 2. The corresponding folder for the tools will be found in:
C:\Program Files\Microsoft Windows Performance Toolkit
Figure 2: Windows Performance Toolkit program group

Leveraging and using xPerf
Once you have WPT (Xperf) installed on the troublesome server, the next thing to do is start a collection of event tracing. There are numerous potential events that can be traced depending on the issue you are troubleshooting. A good place to start is with the Xperf CLI command:
Xperf –on DiagEasy
This will start a collection of events with several kernel providers, including PROC_THREAD, LOADER, DISK_IO, HARD_FAULTS, DPC, INTERRUPT, CSWITCH and PERF_COUNTER, which log the data to an event trace log file called kernel.etl. For a list of all kernel providers, issue this command:
Xperf –providers KG
Note: Extensive online help is available that explains each provider in detail.
Once you have started the collection, allow the server to exhibit the behavior you are troubleshooting and then stop the collection with this command:
Xperf –d trace.etl
This will merge the data that was buffered in kernel.etl and create a final trace file called trace.etl. This trace file can be analyzed on the server where the problem is occurring or on a different server where WPT is also installed. To view the resulting graphs and charts, use this command:
Xperf trace.etl
The trace file will be processed in two passes, producing a variety of graphs. The default graphs include:
- CPU usage by CPU
- CPU usage by process
- CPU usage by thread
- CPU idle states
- Disk I/O, Disk utilization
- Disk utilization by process
- Process lifetimes
- DPC CPU usage
- Interrupt CPU usage
- Hard faults
- Generic events
By hovering your mouse pointer over a particular line on the graph, additional details will be provided such as the name of the process that is accumulating all the CPU time. For instance, in Figure 3 you can clearly see how the antivirus process Rtvscan.exe is dominating the CPU usage.
Figure 3: CPU Usage by Process graph (click to enlarge)

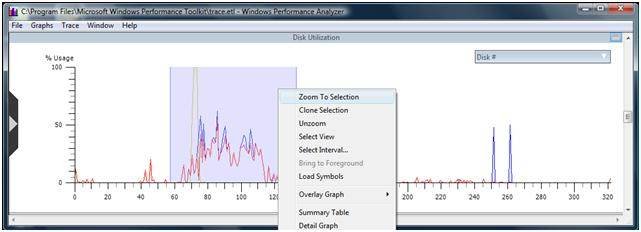
Another nice benefit of using Xperf is the ability to zoom in on a particular time range to take a closer look at the graph. In Figure 4, you can see the Disk Utilization graph shows a spike in activity after the first 60 seconds. Zoom in on the time period in question by using the mouse pointer to click and drag over that area of the graph, then right-click and choose Zoom To Selection. This will produce another graph for just the time period you specified. To revert to the original graph, right-click the graph and select Unzoom.
Figure 4: Xperf zoom feature (click to enlarge)
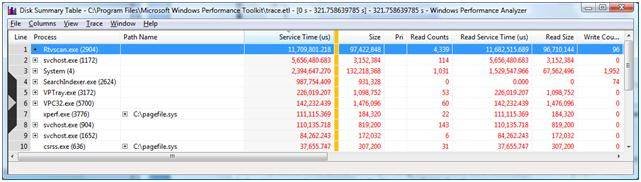
To get even more detailed, you can right-click a graph and select Summary Table. This will produce a chart that documents all the corresponding counters and data associated with the graph. For instance, Figure 5 illustrates the Disk Summary Table for the Disk I/O graph. Line 1 of the chart clearly shows how the Rtvscan.exe process is accumulating massive read counts, which would be expected for an antivirus scan.
Figure 5: Disk Summary Table for the Disk I/O graph (click to enlarge)
As you can see, Xperf is a very powerful and intuitive tool that can really help you drill down on performance issues. I have just touched the tip of the iceberg with regards to Xperf’s capabilities, however, as the tool is also great for slow boot investigation, high kernel and interrupt times and hot file analysis. Each of these areas alone deserves its own discussion of the features and benefits.

Leave a comment